Environmental Analysis
The wealth of natural resources within Otsego County is important to the overall health and vigor of the community; these resources are an economic anchor and play a key role in the quality of life for county residents. The study area traverses rolling hills, forestlands, farmlands, open spaces and high quality water resources, presenting an ever changing array of scenic vistas. Natural resources within the 1/2 mile wide corridor are connected to much larger regional landscape features, and as a result, activities within the study area can have far reaching effects. The natural resources addressed in this chapter include forests, wetlands, farmlands, soils and water. A soils based analysis of development constraints will also be included in this chapter.
Natural Resources
Forests
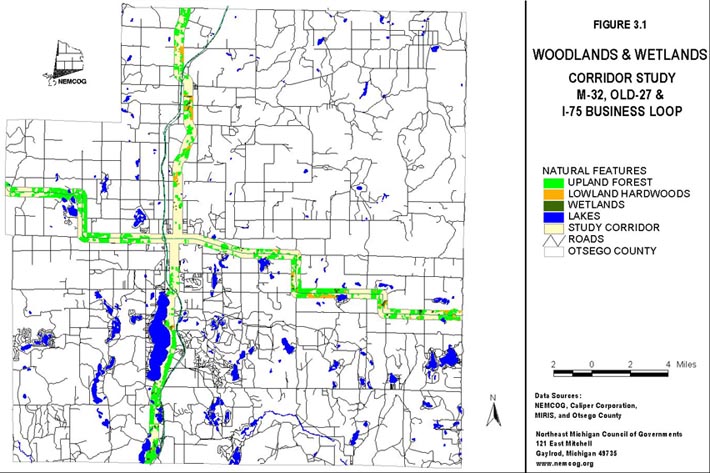
In addition to the scenic characteristics of woodlands, forested areas provide habitat for wildlife, protect the soil from erosion, filter air pollutants and act as a noise buffer along heavily traveled highways. Public and privately owned forested lands can be found throughout the corridor study area. Forest lands were mapped as a part of the existing land use analysis in Chapter 2. As noted in Chapter 2, woodland areas, both upland and lowland forest types, cover over 32 percent of the study area. Figure 3.1 is a map depicting the location of woodlands and wetlands within the study corridor.
The dominant forest associations in the corridor study area are northern hardwoods (sugar maple, American beech and basswood); aspen/white birch; red and white oak and red pine plantations in the upland areas. Lowland forest species include black ash, slippery elm, red maple, northern white cedar, black spruce and eastern tamarack.
Forests along the western segment of the M-32 corridor, Elmira east to Gaylord, consists of red pine and scotch pine plantations and northern hardwoods. The eastern segment of the M-32 corridor, from Gaylord east to the County line, can be characterized by northern hardwoods growing either in woodlots associated with farms or in large tract forests associated with regional ecological corridors. Small stands of lowland hardwoods and lowland conifers can be found adjacent to several lakes and drainageways. Forested areas within the northern segment of the Old 27 corridor, from Gaylord to the north County line, consist of northern hardwood forests, interspersed with lowland hardwood and conifer woodlands. The southern segment of the study area, from Gaylord to the south County line is dominated by large tract aspen and oak forests.
Wetlands
A wetland is land where water is found at or near the surface, some time during the year. Poorly drained soils and water-loving vegetation may also be present. Wetlands are referred to as marshes, swamps, cedar swamps or bogs. The wetland areas are associated with lakes, rivers, creeks and intermittent drainages. Three of the most important functions of wetlands are water quality protection, groundwater discharge, and recharge and ecological corridors. The interconnected nature of wetlands and surface water resources exemplify how activities distant from major water bodies can still have an impact on the water quality.
Figure 3.1
Woodlands and wetlands
Lowland forests, typically classified as wetlands, account for the largest wetland plant community types in the study area. Tracts of lowland forests are located near Parmater,
McGregor, Bagley and Matelski Roads in the northern segment of the corridor and west of Lewis Lake along the eastern segment. Species include northern white cedar, eastern tamarack, black spruce, white spruce, balsam fir, black ash, elm, red maple, balsam poplar, and aspen. The lowland brush wetlands include stable shrub wetlands and areas in successional stage leading to wooded wetlands. Species include alder, red osier and silky dogwoods, sweetgale, willow-buttonbush and shrub willows. Aquatic bed wetlands are flooded areas with submerged plants, floating leafed or floating plants growing in seven feet or less of water. Typical plant species are water Lilly, duck weed and pond weeds. Emergent wetland areas are dominated by erect, rooted, herbaceous hydrophytic plants. These perennial and annual plants include cattails, bulrush, sedges, reeds, pickerel weed and arrowhead.
Water
The corridor study area is located in the headwaters of several major river systems. While the corridor traverses the upper reaches of the Black, Pigeon, Sturgeon, Au Sable, Manistee, and Boyne River systems, the corridor does not actually cross over any of the main river channels. However, the many lakes, creeks and associated wetlands are hydrologically connected to these main river systems. These water resources provide important wildlife habitat as well as recreational opportunities for residents and visitors alike. The demand for waterfront properties for residential uses will continue to increase in the years to come. Protecting these traditional waterfront developments from intrusive development and highway related noise pollution is paramount to maintaining the integrity of neighborhoods and quality of the water resources.
The southern segment of the study area abounds with surface water resources. Numerous lakes, including Otsego Lake, the largest lake the County, are located within this stretch of the corridor. Dodge, Hatch, Heart, Big Bradford, and Marjory Lakes are also located along the southern segment of the corridor. Big, Lewis and Swede Lakes are located in the eastern segment and Lake 27, Martin and Pettifor Lakes are located in the western segment of the corridor area.
Agriculture
In addition to helping support the local economy, farms are an important component of the rural landscape of the area. Farmlands were mapped as a part of the existing land use analysis in Chapter 2. The total agricultural land use in the corridor study area is approximately 2,347 acres, or
13.8% of the total. Over 60 percent or 1,600 acres of the 2,347 acres of agricultural land use is located in the eastern segment of the corridor, from Gaylord east to the county line. The supply of
farmland, particularly prime farmland, is limited in the county. Local and national trends indicate conversion of farmland to urban built-up uses continues to increase at an alarming rate. There are a number of factors, both locally and nation-wide that are driving the conversion of farmlands. Ironically, the soil and topographic conditions that make the land favorable for farming (relatively level, well drained soils), also make the land desirable for development.
Along with identifying active farmlands on the existing land use survey, the prime agricultural soils can be identified on the USDA soils survey. Prime farmland, as defined by the U.S. Department of Agriculture, is land having the best combination of physical and chemical characteristics for producing food, feed, forage, fiber, and oilseed crops, and is available for these uses. Prime farmland could be cultivated land, pasture land, forest land, or other land, but not urban built-up
land or water areas. The U.S. Department of Agriculture, Natural Resource Conservation Service, has developed detailed soil surveys of Otsego County. NEMCOG encoded the soil survey sheets
into a Geographic Information System (GIS) or computer mapping system. An analysis of soils survey maps enables a community to identify areas best suited for crop and timber production. The prime agricultural soils were identified and overlaid onto the existing land use map. This technique allows for the identification of active farmland as well as forest land on prime farmland soils. Efforts to preserve and retain farmland and woodlands should focus on areas best suited for those purposes. Figure 3.2 shows the location of farmland and farmland/woodlands on prime farmland soils in the corridor.
Soil Constraints
Soil characteristics help to define the lands capacity to support certain types of land uses. Land uses must correspond to the capacity of the soils on which they occur, and soil suitability for each use should be determined before development occurs.
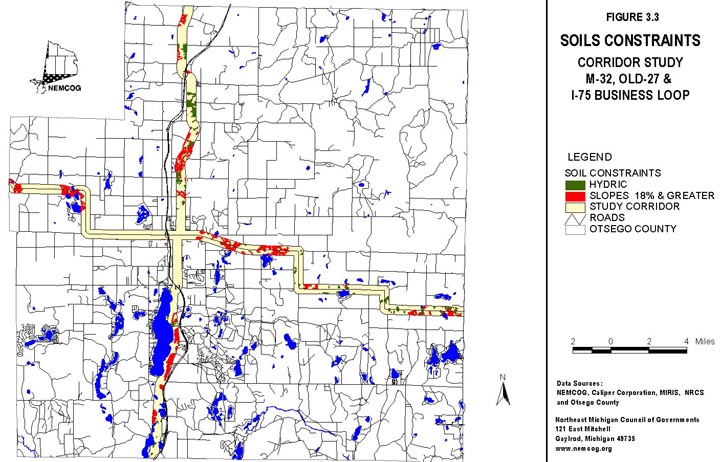
The digital or computerized version of the soil survey maps can be used to flag potential wetland areas and areas with steep slopes. Using information contained within the published soil survey book, soils mapping units have been classified as hydric and slopes 18 percent and greater. Figure 3.3 depicts these soils constraints within the corridor study area.
Slopes 18% and greater
Areas with steep slopes, while often providing spectacular views of the landscape, are difficult and costly to develop. Areas with steep slopes have severe constraints for on-site septic systems. Erosion both during and after construction can be difficult to manage. Construction of new homes and roads on steep slopes can cause both short term and long term environmental impacts. Furthermore, construction and maintenance costs tends to be higher on steeply sloped terrain. Special design standards such as erosion control measures, limiting size of disturbed areas, retaining natural vegetation, revegetation, slope stabilization and on-site retention of water run-off from impervious surfaces would all serve to minimize resource impacts.
Areas with steep slopes can be found throughout the study area. Several of those locations include M-32 east of Gaylord between Krys Road and Turtle Lake Road; M-32 around Lake 27, Martin and Pettifor Lakes; South Old 27 between Charles Brink and Mancelona Roads; and North Old 27 between Parmater and Matelski Roads.
Hydric Soils
Hydric soils are saturated, flooded or ponded during part of the growing season and are classified as poorly drained and very poorly drained soils. Hydric soils have poor potential for building site development and sanitary facilities. Adequate depth to the water table is necessary to prevent groundwater contamination from septic systems. Though civil engineering techniques can be employed to improve drainage and maintain adequate separation from the water table, such techniques are expensive to construct and maintain, in addition to having long term negative impacts on water and wildlife resources. The areas mapped as hydric soils coincide with wetlands and lowland forests discussed above.
Figure 3.2
Prime Farmland
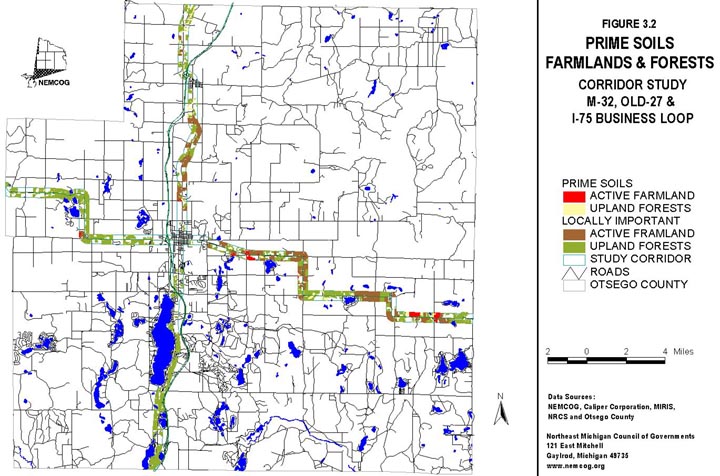
Figure 3.3
Soils Constraints
Building Site Development
The USDA soil survey for Otsego soils are rated for various uses such as building site development and the most limiting factors are identified. The rating system is slight, moderate and severe limitations. Using the rating system developed by USDA, soils limitations for buildings without basements have been mapped, Figure 3.4. Areas with well drained soils and slopes less than 10 percent tend to have slight limitations for building development. The maps shows there slight limitations for building development in the greater Gaylord area. This area is relatively level and primarily well drained sandy soils.
Septic Systems
Utilizing a GIS allows soils types to be classified and color coded according to suitability classes (slight, moderate or severe limitations for septic drainfields) defined by the USDA Natural Resource Conservation Service. Criteria include depth to water table, wetness, filtering capacity and ability to perc water. Figure 3.5 is a septic system limitations map. A large segment of the corridor contains sandy soils with severe limitations due to poor filteration of septic effluents. This is a critical issue when the water table is close to the surface or when high density development occurs. Note in greater Gaylord, areas with slight limitations for buildings have severe limitations for septic systems. This is attributed to the poor filtering capacity of the sandy soils. Limiting types and density of development or making public water and sewer available for high density development are likely the best options for protecting the groundwater resources in this area.
Urban Forests
Urban forests, like their country counterparts, provide a wide range of ecological and economic benefits. Ecological benefits range from carbon dioxide recycling, pollution reduction, climate enhancement, erosion control, wildlife habitat, and water cycling/reduction of stormwater runoff. Several economic benefits are enhancing property values, reducing heating and cooling costs, and reducing communities' reliance on stormwater conveyance systems. Residential and commercial areas with healthy, growing urban forests tend to be more desirable places to live, work and shop.
Healthy urban forests are characterized as having trees of varying age, sizes and species; along with lower layers of shrubs and ground cover vegetation. The urban built-up areas in the corridor can be grouped into three categories: mature forests, young forests and lacking/minimal forests. Mature urban forests can be found in the residential neighborhoods of Gaylord and Vanderbilt. A wide variety of tree species are growing in the urban forests, however, sugar maple, Norway maple, and silver maple are most numerous. The young urban forests, growing along Gaylord's Main Street, were planted during a streetscaping project in the early 1990's. This area includes the downtown business district bordering M-32, from Center Street west to the I-75 interchange. The final category of minimal/lacking urban forest is prevalent in the commercial strip development areas along the corridor. Trees are few as well as ground cover and shrubs; concrete, asphalt and utility poles prevail. These areas are found along west M-32 between the I-75 interchange and North Townline Road; Center Street / Old 27 from North Street to 1/2 mile south of Congdon Road; I-75 Business/Old 27 from Grandview Boulevard south to the I-75 Interchange; segments of Old 27 South between Robert's Avenue and Maple Drive and within the Community of Waters; and the Vanderbilt I-75 interchange into the downtown of the Village. While trees and shrubs are lacking, there is considerable green space or grassy areas where trees and shrubs could be planted through a community streetscape beautification program. See Figure 3.6, Gaylord Urban Forest Cover.
Figure 3.4
Building Site Development
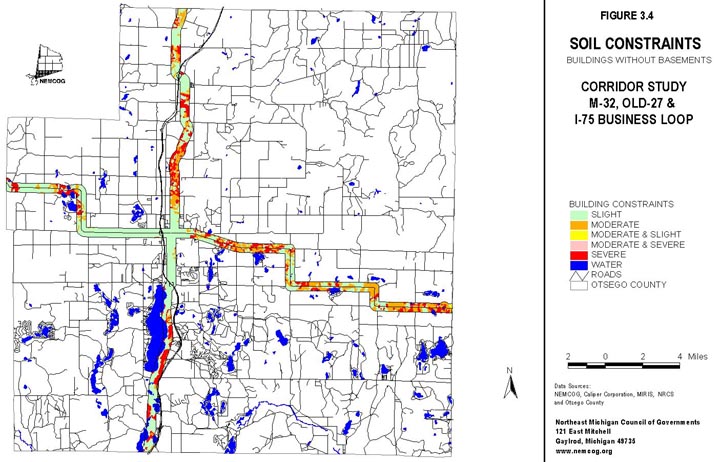
Figure 3.5
Septic Constraints
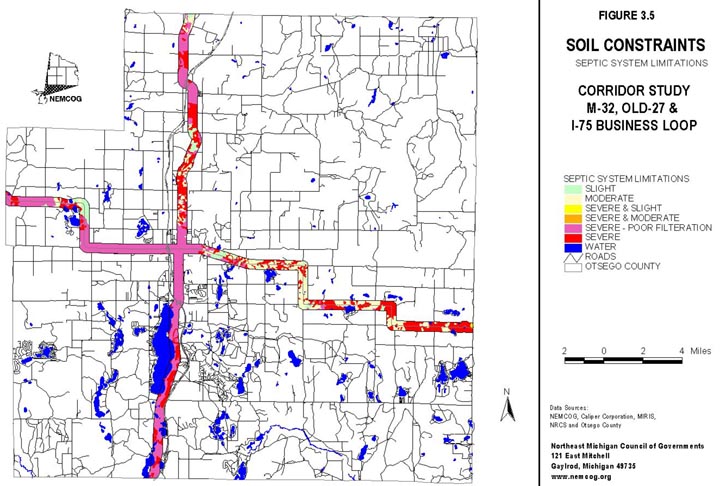
Figure 3.6
Gaylord Urban Forest Cover